UPDATE: actionETL 0.41.0 onward uses Microsoft.Data.SqlClient 4.x or later, and avoids the SqlClient Batch Insert performance issue mentioned below.
In this article, we look at the great database insert performance you can achieve with the actionETL dataflow and .NET. In particular, we look at how the choice of SQL database, database provider, and bulk insert vs. batch insert impacts performance.
Setup

- The benchmark generates rows with the RepeatRowsSource worker
- Batch Insert puts multiple rows in each insert statement. The AdbInsertTarget worker supports all actionETL database providers.
- Insert statements use (named or positional) parameters. Each parameter inserts one column value in one row in the table.
- Bulk Insert requires a database-specific facility and is available for MySQL-compatible and SQL Server databases via the AdbMySqlConnectorBulkInsertTarget and AdbSqlClientBulkInsertTarget workers.
- The target table is unindexed with 10 columns (4 integer, 4 text, 2 decimal).
- All databases and the actionETL .NET5 benchmark run locally on the same Windows 10 host, an old 4-core Intel Core i7 4770K, 3.5GHz desktop PC from 2013 with a Samsung 840 EVO 1TB SSD.
Throughput
Here we generate and insert 1 million rows into the target table, and report the number of values inserted per second.
Note: At larger volumes and in this benchmark, insert queries are mainly bottlenecked by the number of values to insert, which is why we report that number. To get the number of rows instead for our particular test, divide by 10.
We measure:
- Batch Insert Default, which uses a batch size of 256 values per batch and 16,384 values per transaction.
- Batch Insert Tuned, which uses tuned values for batch and transaction sizes.
- Note: This often uses the largest possible settings, but it must be done with caution, since it can overload the server if used with very large data volumes.
- Bulk Insert, where supported.

Several things stand out:
- Bulk Insert as well as the (embedded database) SQLite Batch Insert Tuned tests are from 2.5 to 15 times faster than the other tests and databases, and should (from a strict throughput performance standpoint) be used whenever possible.
- Tuning Batch Insert settings provides a 14% to 54% improvement for non-SQLite tests and a 443% improvement for the SQLite test.
- UPDATE: actionETL 0.41.0 onward uses Microsoft.Data.SqlClient 4.x or later, and avoids this performance issue:
The SqlClient Batch Insert tests have unexpectedly low performance. In fact, our benchmark discovered a previously unknown SQL Server bottleneck. The SqlClient team is developing a workaround, and when it’s released we’ll take advantage of it in actionETL.- In preliminary testing with the unreleased workaround, SqlClient Batch Insert achieves a performance roughly 12% better than ODBC SQL Server, which would make it the fastest non-embedded Batch Insert in our tests.
With actionETL, you can however already use either SqlClient Bulk Insert or the ODBC SQL Server provider combination, which both deliver great performance.
Throughput Scaling
In these tests we generate and insert between 1 row and 1 million rows, and again report the number of values inserted per second. The Batch Insert tests use default batch and transaction size settings.
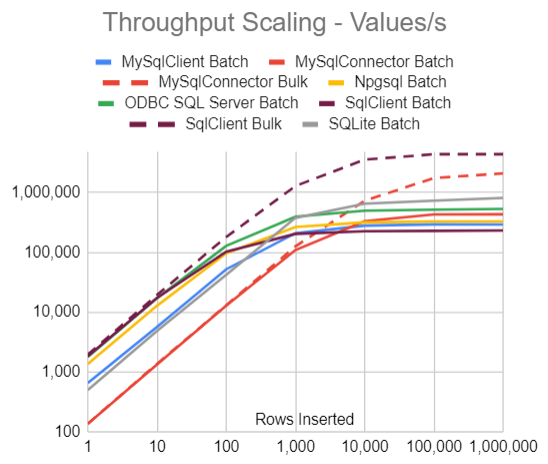
We see that:
- There is an order-of-magnitude performance difference between the fastest and slowest database-provider-API combination, both for small and large volumes.
- SqlClient Bulk is the fastest across all volumes.
- Even though the database etc. is warmed up with an insert before measurements are started, the overhead of opening a connection, initiating the inserts, etc. in the measured run is large enough to completely limit the throughput up to 1,000 parameters (100 rows), and mostly also up to 10,000 values (1,000 rows).
- For small volumes, Bulk Insert (on those databases that support it) has the same performance as Batch Insert.
Here is the same data in a table:
| Rows Inserted | 1 | 10 | 100 | 1,000 | 10,000 | 100,000 | 1,000,000 |
|---|---|---|---|---|---|---|---|
| MySqlClient Batch | 652 | 5,686 | 52,268 | 209,848 | 280,920 | 294,748 | 294,147 |
| MySqlConnector Batch | 136 | 1,339 | 12,860 | 109,279 | 331,885 | 430,429 | 432,934 |
| MySqlConnector Bulk | 137 | 1,371 | 13,058 | 126,161 | 733,025 | 1,751,191 | 2,095,514 |
| Npgsql Batch | 1,358 | 12,842 | 96,534 | 266,640 | 318,638 | 329,748 | 330,148 |
| ODBC SQL Server Batch | 1,780 | 17,150 | 128,562 | 396,670 | 497,223 | 517,184 | 534,700 |
| SqlClient Batch | 1,838 | 17,364 | 102,841 | 204,082 | 225,870 | 229,410 | 232,350 |
| SqlClient Bulk | 1,956 | 19,464 | 181,010 | 1,289,693 | 3,569,541 | 4,382,258 | 4,382,097 |
| SQLite Batch | 501 | 4,849 | 42,224 | 378,911 | 652,616 | 732,463 | 814,030 |
In Summary
If you are not bottlenecked by other factors (slow network, slow inserts due to indexing, etc.), then your choice of database, provider and insert API combination can make a huge performance difference.
One common way to realize these performance advantages is to perform record-level processing in the dataflow, load data into unindexed staging tables, and finish up with set-based processing in the database.
Do use Bulk Insert where available for best performance.
Do benchmark your own use cases with different API, providers, and settings to pick the best combination.
And certainly, actionETL helps you by providing and making it easy to switch between Batch Insert and Bulk Insert across the various databases. Try it out yourself with the free Community edition!
Nitty-gritty
Database and Provider Details
| Provider | Database | Tuned Rows per Batch | Tuned Rows per Transaction |
|---|---|---|---|
| MySqlClient Batch | MariaDB 10.3 | 200 | long.MaxValue |
| MySqlConnector Batch | MariaDB 10.3 | 200 | long.MaxValue |
| MySqlConnector Bulk | MariaDB 10.3 | N/A | N/A |
| Npgsql Batch | PostgreSQL 12 | 200 | long.MaxValue |
| System.Data.Odbc Batch | SQL Server 2019 | 99 | long.MaxValue |
| Microsoft.Data.SqlClient Batch | SQL Server 2019 | 13 | long.MaxValue |
| Microsoft.Data.SqlClient Bulk | SQL Server 2019 | N/A | N/A |
| System.Data.SQLite Batch | SQLite.Core 1.0.113.6 | 25 | long.MaxValue |
actionETL Code
The benchmark was run with actionETL 0.40.0 on .NET5.
Dataflow row type:
class MyRow
{
    public long Data1 { get; }
    public long Data2 { get; } = 2000;
    public long Data3 { get; } = 3000;
    public long Data4 { get; } = 4000;
    public string Text1 { get; } = "Text5";
    public string Text2 { get; } = "Text567890";
    public string Text3 { get; } = "Text56789012345";
    public string Text4 { get; } = "Text5678901234567890";
    public decimal Number1 { get; } = 3.14M;
    public decimal Number2 { get; } = 7.92M;

    public MyRow(long data) => Data1 = data;
}
Dataflow code for batch insert:
var source = new RepeatRowsSource<MyRow>(aw, "Generate Rows"
    , numberOfRows, new MyRow(42)) { SendTemplateRows = true };

source.Output.Link.AdbInsertTarget("Insert Rows", cmca => cmca.AutoName()
    , connectionString.CreateConnectionBuilder(), tableName);
source.SetRowLimits(rowsPerBatch, rowsPerTransaction); // Optional
Dataflow target for MySQL bulk insert (replacing AdbInsertTarget above):
source.Output.Link.AdbMySqlConnectorBulkInsertTarget("Insert Rows"
    , cmca => cmca.AutoName(), connectionString.CreateConnectionBuilder()
    , tableName);
Dataflow target for SQL Server bulk insert (replacing AdbInsertTarget above):
source.Output.Link.AdbSqlClientBulkInsertTarget("Insert Rows"
    , cmca => cmca.AutoName(), connectionString.CreateConnectionBuilder()
    , SqlBulkCopyOptions.TableLock, tableName);